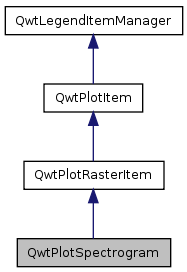
A plot item, which displays a spectrogram. More...
#include <qwt_plot_spectrogram.h>
Classes | |
| class | PrivateData |
Public Types | |
| enum | DisplayMode { ImageMode = 1, ContourMode = 2 } |
Public Member Functions | |
| QwtPlotSpectrogram (const QString &title=QString::null) | |
| virtual | ~QwtPlotSpectrogram () |
| Destructor. | |
| void | setDisplayMode (DisplayMode, bool on=true) |
| bool | testDisplayMode (DisplayMode) const |
| void | setData (const QwtRasterData &data) |
| const QwtRasterData & | data () const |
| void | setColorMap (const QwtColorMap &) |
| const QwtColorMap & | colorMap () const |
| virtual QwtDoubleRect | boundingRect () const |
| virtual QSize | rasterHint (const QwtDoubleRect &) const |
| Returns the recommended raster for a given rect. | |
| void | setDefaultContourPen (const QPen &) |
| Set the default pen for the contour lines. | |
| QPen | defaultContourPen () const |
| virtual QPen | contourPen (double level) const |
| Calculate the pen for a contour line. | |
| void | setConrecAttribute (QwtRasterData::ConrecAttribute, bool on) |
| bool | testConrecAttribute (QwtRasterData::ConrecAttribute) const |
| void | setContourLevels (const QwtValueList &) |
| QwtValueList | contourLevels () const |
| Return the levels of the contour lines. | |
| virtual int | rtti () const |
| virtual void | draw (QPainter *p, const QwtScaleMap &xMap, const QwtScaleMap &yMap, const QRect &rect) const |
| Draw the spectrogram. | |
Protected Member Functions | |
| virtual QImage | renderImage (const QwtScaleMap &xMap, const QwtScaleMap &yMap, const QwtDoubleRect &rect) const |
| Render an image from the data and color map. | |
| virtual QSize | contourRasterSize (const QwtDoubleRect &, const QRect &) const |
| Return the raster to be used by the CONREC contour algorithm. | |
| virtual QwtRasterData::ContourLines | renderContourLines (const QwtDoubleRect &rect, const QSize &raster) const |
| virtual void | drawContourLines (QPainter *p, const QwtScaleMap &xMap, const QwtScaleMap &yMap, const QwtRasterData::ContourLines &lines) const |
A plot item, which displays a spectrogram.
A spectrogram displays threedimenional data, where the 3rd dimension ( the intensity ) is displayed using colors. The colors are calculated from the values using a color map.
In ContourMode contour lines are painted for the contour levels.

Definition at line 35 of file qwt_plot_spectrogram.h.
The display mode controls how the raster data will be represented.
When both modes are enabled the contour lines are painted on top of the spectrogram. The default setting enables ImageMode.
Definition at line 51 of file qwt_plot_spectrogram.h.
    {
        ImageMode = 1,
        ContourMode = 2
    };
| QwtPlotSpectrogram::QwtPlotSpectrogram | ( | const QString & | title = QString::null ) |
[explicit] |
Sets the following item attributes:
The z value is initialized by 8.0.
| title | Title |
Definition at line 134 of file qwt_plot_spectrogram.cpp.
References QwtPlotItem::AutoScale, QwtPlotItem::Legend, QwtPlotItem::setItemAttribute(), and QwtPlotItem::setZ().
                                                          :
    QwtPlotRasterItem(title)
{
    d_data = new PrivateData();

    setItemAttribute(QwtPlotItem::AutoScale, true);
    setItemAttribute(QwtPlotItem::Legend, false);

    setZ(8.0);
}
| QwtPlotSpectrogram::~QwtPlotSpectrogram | ( | ) | [virtual] |
| QwtDoubleRect QwtPlotSpectrogram::boundingRect | ( | ) | const [virtual] |
Reimplemented from QwtPlotItem.
Definition at line 368 of file qwt_plot_spectrogram.cpp.
References QwtRasterData::boundingRect(), and QwtPlotSpectrogram::PrivateData::data.
Referenced by draw().
{
    return d_data->data->boundingRect();
}
| const QwtColorMap & QwtPlotSpectrogram::colorMap | ( | ) | const |
Definition at line 215 of file qwt_plot_spectrogram.cpp.
References QwtPlotSpectrogram::PrivateData::colorMap.
{
    return *d_data->colorMap;
}
| QwtValueList QwtPlotSpectrogram::contourLevels | ( | ) | const |
Return the levels of the contour lines.
The levels are sorted in increasing order.
Definition at line 335 of file qwt_plot_spectrogram.cpp.
References QwtPlotSpectrogram::PrivateData::contourLevels.
{
    return d_data->contourLevels;
}
| QPen QwtPlotSpectrogram::contourPen | ( | double | level ) | const [virtual] |
Calculate the pen for a contour line.
The color of the pen is the color for level calculated by the color map
| level | Contour level |
Definition at line 259 of file qwt_plot_spectrogram.cpp.
References QwtPlotSpectrogram::PrivateData::colorMap, QwtPlotSpectrogram::PrivateData::data, QwtRasterData::range(), and QwtColorMap::rgb().
Referenced by drawContourLines().
{
    const QwtDoubleInterval intensityRange = d_data->data->range();
    const QColor c(d_data->colorMap->rgb(intensityRange, level));

    return QPen(c);
}
| QSize QwtPlotSpectrogram::contourRasterSize | ( | const QwtDoubleRect & | area, |
| const QRect & | rect | ||
| ) | const [protected, virtual] |
Return the raster to be used by the CONREC contour algorithm.
A larger size will improve the precisision of the CONREC algorithm, but will slow down the time that is needed to calculate the lines.
The default implementation returns rect.size() / 2 bounded to data().rasterHint().
| area | Rect, where to calculate the contour lines |
| rect | Rect in pixel coordinates, where to paint the contour lines |
Definition at line 533 of file qwt_plot_spectrogram.cpp.
References QwtPlotSpectrogram::PrivateData::data, QwtRasterData::rasterHint(), and rasterHint().
Referenced by draw().
{
    QSize raster = rect.size() / 2;

    const QSize rasterHint = d_data->data->rasterHint(area);
    if ( rasterHint.isValid() )
        raster = raster.boundedTo(rasterHint);

    return raster;
}
| const QwtRasterData & QwtPlotSpectrogram::data | ( | ) | const |
Definition at line 359 of file qwt_plot_spectrogram.cpp.
References QwtPlotSpectrogram::PrivateData::data.
{
    return *d_data->data;
}
| QPen QwtPlotSpectrogram::defaultContourPen | ( | ) | const |
Definition at line 243 of file qwt_plot_spectrogram.cpp.
References QwtPlotSpectrogram::PrivateData::defaultContourPen.
Referenced by drawContourLines().
{
    return d_data->defaultContourPen;
}
| void QwtPlotSpectrogram::draw | ( | QPainter * | painter, |
| const QwtScaleMap & | xMap, | ||
| const QwtScaleMap & | yMap, | ||
| const QRect & | canvasRect | ||
| ) | const [virtual] |
Draw the spectrogram.
| painter | Painter |
| xMap | Maps x-values into pixel coordinates. |
| yMap | Maps y-values into pixel coordinates. |
| canvasRect | Contents rect of the canvas in painter coordinates |
Reimplemented from QwtPlotRasterItem.
Definition at line 620 of file qwt_plot_spectrogram.cpp.
References boundingRect(), ContourMode, contourRasterSize(), QwtPlotSpectrogram::PrivateData::displayMode, drawContourLines(), ImageMode, QwtPlotItem::invTransform(), QwtDoubleRect::isValid(), renderContourLines(), and QwtPlotItem::transform().
{
    if ( d_data->displayMode & ImageMode )
        QwtPlotRasterItem::draw(painter, xMap, yMap, canvasRect);

    if ( d_data->displayMode & ContourMode )
    {
        // Add some pixels at the borders, so that
        const int margin = 2;
        QRect rasterRect(canvasRect.x() - margin, canvasRect.y() - margin,
            canvasRect.width() + 2 * margin, canvasRect.height() + 2 * margin);

        QwtDoubleRect area = invTransform(xMap, yMap, rasterRect);

        const QwtDoubleRect br = boundingRect();
        if ( br.isValid() )
        {
            area &= br;
            if ( area.isEmpty() )
                return;

            rasterRect = transform(xMap, yMap, area);
        }

        QSize raster = contourRasterSize(area, rasterRect);
        raster = raster.boundedTo(rasterRect.size());
        if ( raster.isValid() )
        {
            const QwtRasterData::ContourLines lines =
                renderContourLines(area, raster);

            drawContourLines(painter, xMap, yMap, lines);
        }
    }
}
| void QwtPlotSpectrogram::drawContourLines | ( | QPainter * | painter, |
| const QwtScaleMap & | xMap, | ||
| const QwtScaleMap & | yMap, | ||
| const QwtRasterData::ContourLines & | contourLines | ||
| ) | const [protected, virtual] |
Paint the contour lines
| painter | Painter |
| xMap | Maps x-values into pixel coordinates. |
| yMap | Maps y-values into pixel coordinates. |
| contourLines | Contour lines |
Definition at line 571 of file qwt_plot_spectrogram.cpp.
References QwtPlotSpectrogram::PrivateData::contourLevels, contourPen(), QwtPlotSpectrogram::PrivateData::data, defaultContourPen(), QwtPainter::drawLine(), int(), QwtRasterData::range(), QwtPainter::scaledPen(), and QwtScaleMap::transform().
Referenced by draw().
{
    const QwtDoubleInterval intensityRange = d_data->data->range();

    const int numLevels = (int)d_data->contourLevels.size();
    for (int l = 0; l < numLevels; l++)
    {
        const double level = d_data->contourLevels[l];

        QPen pen = defaultContourPen();
        if ( pen.style() == Qt::NoPen )
            pen = contourPen(level);

        if ( pen.style() == Qt::NoPen )
            continue;

        painter->setPen(QwtPainter::scaledPen(pen));

#if QT_VERSION >= 0x040000
        const QPolygonF &lines = contourLines[level];
#else
        const QwtArray<QwtDoublePoint> &lines = contourLines[level];
#endif
        for ( int i = 0; i < (int)lines.size(); i += 2 )
        {
            const QPoint p1( xMap.transform(lines[i].x()),
                yMap.transform(lines[i].y()) );
            const QPoint p2( xMap.transform(lines[i+1].x()),
                yMap.transform(lines[i+1].y()) );

            QwtPainter::drawLine(painter, p1, p2);
        }
    }
}
| QSize QwtPlotSpectrogram::rasterHint | ( | const QwtDoubleRect & | rect ) | const [virtual] |
Returns the recommended raster for a given rect.
F.e the raster hint is used to limit the resolution of the image that is rendered.
| rect | Rect for the raster hint |
Reimplemented from QwtPlotRasterItem.
Definition at line 382 of file qwt_plot_spectrogram.cpp.
References QwtPlotSpectrogram::PrivateData::data, and QwtRasterData::rasterHint().
Referenced by contourRasterSize().
{
    return d_data->data->rasterHint(rect);
}
| QwtRasterData::ContourLines QwtPlotSpectrogram::renderContourLines | ( | const QwtDoubleRect & | rect, |
| const QSize & | raster | ||
| ) | const [protected, virtual] |
Calculate contour lines
| rect | Rectangle, where to calculate the contour lines |
| raster | Raster, used by the CONREC algorithm |
Definition at line 554 of file qwt_plot_spectrogram.cpp.
References QwtPlotSpectrogram::PrivateData::conrecAttributes, QwtPlotSpectrogram::PrivateData::contourLevels, QwtRasterData::contourLines(), and QwtPlotSpectrogram::PrivateData::data.
Referenced by draw().
{
    return d_data->data->contourLines(rect, raster,
        d_data->contourLevels, d_data->conrecAttributes );
}
| QImage QwtPlotSpectrogram::renderImage | ( | const QwtScaleMap & | xMap, |
| const QwtScaleMap & | yMap, | ||
| const QwtDoubleRect & | area | ||
| ) | const [protected, virtual] |
Render an image from the data and color map.
The area is translated into a rect of the paint device. For each pixel of this rect the intensity is mapped into a color.
| xMap | X-Scale Map |
| yMap | Y-Scale Map |
| area | Area that should be rendered in scale coordinates. |
Implements QwtPlotRasterItem.
Definition at line 404 of file qwt_plot_spectrogram.cpp.
References QwtColorMap::colorIndex(), QwtPlotSpectrogram::PrivateData::colorMap, QwtColorMap::colorTable(), QwtPlotSpectrogram::PrivateData::data, QwtRasterData::discardRaster(), QwtColorMap::format(), QwtDoubleRect::height(), QwtColorMap::Indexed, QwtRasterData::initRaster(), QwtScaleMap::invTransform(), QwtDoubleRect::isEmpty(), QwtScaleMap::p1(), QwtScaleMap::p2(), QwtRasterData::range(), QwtRasterData::rasterHint(), QwtColorMap::rgb(), QwtColorMap::RGB, QwtScaleMap::s1(), QwtScaleMap::s2(), QwtScaleMap::setPaintInterval(), QwtScaleMap::setScaleInterval(), QwtDoubleRect::size(), QwtPlotItem::transform(), QwtRasterData::value(), QwtDoubleRect::width(), QwtDoubleRect::x(), and QwtDoubleRect::y().
{
    if ( area.isEmpty() )
        return QImage();

    QRect rect = transform(xMap, yMap, area);

    QwtScaleMap xxMap = xMap;
    QwtScaleMap yyMap = yMap;

    const QSize res = d_data->data->rasterHint(area);
    if ( res.isValid() )
    {
        /*
          It is useless to render an image with a higher resolution
          than the data offers. Of course someone will have to
          scale this image later into the size of the given rect, but f.e.
          in case of postscript this will done on the printer.
         */
        rect.setSize(rect.size().boundedTo(res));

        int px1 = rect.x();
        int px2 = rect.x() + rect.width();
        if ( xMap.p1() > xMap.p2() )
            qSwap(px1, px2);

        double sx1 = area.x();
        double sx2 = area.x() + area.width();
        if ( xMap.s1() > xMap.s2() )
            qSwap(sx1, sx2);

        int py1 = rect.y();
        int py2 = rect.y() + rect.height();
        if ( yMap.p1() > yMap.p2() )
            qSwap(py1, py2);

        double sy1 = area.y();
        double sy2 = area.y() + area.height();
        if ( yMap.s1() > yMap.s2() )
            qSwap(sy1, sy2);

        xxMap.setPaintInterval(px1, px2);
        xxMap.setScaleInterval(sx1, sx2);
        yyMap.setPaintInterval(py1, py2);
        yyMap.setScaleInterval(sy1, sy2);
    }

    QwtPlotSpectrogramImage image(rect.size(), d_data->colorMap->format());

    const QwtDoubleInterval intensityRange = d_data->data->range();
    if ( !intensityRange.isValid() )
        return image;

    d_data->data->initRaster(area, rect.size());

    if ( d_data->colorMap->format() == QwtColorMap::RGB )
    {
        for ( int y = rect.top(); y <= rect.bottom(); y++ )
        {
            const double ty = yyMap.invTransform(y);

            QRgb *line = (QRgb *)image.scanLine(y - rect.top());
            for ( int x = rect.left(); x <= rect.right(); x++ )
            {
                const double tx = xxMap.invTransform(x);

                *line++ = d_data->colorMap->rgb(intensityRange,
                    d_data->data->value(tx, ty));
            }
        }
    }
    else if ( d_data->colorMap->format() == QwtColorMap::Indexed )
    {
        image.setColorTable(d_data->colorMap->colorTable(intensityRange));

        for ( int y = rect.top(); y <= rect.bottom(); y++ )
        {
            const double ty = yyMap.invTransform(y);

            unsigned char *line = image.scanLine(y - rect.top());
            for ( int x = rect.left(); x <= rect.right(); x++ )
            {
                const double tx = xxMap.invTransform(x);

                *line++ = d_data->colorMap->colorIndex(intensityRange,
                    d_data->data->value(tx, ty));
            }
        }
    }

    d_data->data->discardRaster();

    // Mirror the image in case of inverted maps

    const bool hInvert = xxMap.p1() > xxMap.p2();
    const bool vInvert = yyMap.p1() < yyMap.p2();
    if ( hInvert || vInvert )
    {
#ifdef __GNUC__
#endif
#if QT_VERSION < 0x040000
        image = image.mirror(hInvert, vInvert);
#else
        image = image.mirrored(hInvert, vInvert);
#endif
    }

    return image;
}
| int QwtPlotSpectrogram::rtti | ( | ) | const [virtual] |
Reimplemented from QwtPlotItem.
Definition at line 152 of file qwt_plot_spectrogram.cpp.
References QwtPlotItem::Rtti_PlotSpectrogram.
{
    return QwtPlotItem::Rtti_PlotSpectrogram;
}
| void QwtPlotSpectrogram::setColorMap | ( | const QwtColorMap & | colorMap ) |
Change the color map
Often it is useful to display the mapping between intensities and colors as an additional plot axis, showing a color bar.
| colorMap | Color Map |
Definition at line 202 of file qwt_plot_spectrogram.cpp.
References QwtPlotSpectrogram::PrivateData::colorMap, QwtColorMap::copy(), QwtPlotRasterItem::invalidateCache(), and QwtPlotItem::itemChanged().
{
    delete d_data->colorMap;
    d_data->colorMap = colorMap.copy();

    invalidateCache();
    itemChanged();
}
| void QwtPlotSpectrogram::setConrecAttribute | ( | QwtRasterData::ConrecAttribute | attribute, |
| bool | on | ||
| ) |
Modify an attribute of the CONREC algorithm, used to calculate the contour lines.
| attribute | CONREC attribute |
| on | On/Off |
Definition at line 277 of file qwt_plot_spectrogram.cpp.
References QwtPlotSpectrogram::PrivateData::conrecAttributes, and QwtPlotItem::itemChanged().
{
    if ( bool(d_data->conrecAttributes & attribute) == on )
        return;

    if ( on )
        d_data->conrecAttributes |= attribute;
    else
        d_data->conrecAttributes &= ~attribute;

    itemChanged();
}
| void QwtPlotSpectrogram::setContourLevels | ( | const QwtValueList & | levels ) |
Set the levels of the contour lines
| levels | Values of the contour levels |
Definition at line 316 of file qwt_plot_spectrogram.cpp.
References QwtPlotSpectrogram::PrivateData::contourLevels, and QwtPlotItem::itemChanged().
{
    d_data->contourLevels = levels;
#if QT_VERSION >= 0x040000
    qSort(d_data->contourLevels);
#else
    qHeapSort(d_data->contourLevels);
#endif
    itemChanged();
}
| void QwtPlotSpectrogram::setData | ( | const QwtRasterData & | data ) |
Set the data to be displayed
| data | Spectrogram Data |
Definition at line 346 of file qwt_plot_spectrogram.cpp.
References QwtRasterData::copy(), QwtPlotSpectrogram::PrivateData::data, QwtPlotRasterItem::invalidateCache(), and QwtPlotItem::itemChanged().
{
    delete d_data->data;
    d_data->data = data.copy();

    invalidateCache();
    itemChanged();
}
| void QwtPlotSpectrogram::setDefaultContourPen | ( | const QPen & | pen ) |
Set the default pen for the contour lines.
If the spectrogram has a valid default contour pen a contour line is painted using the default contour pen. Otherwise (pen.style() == Qt::NoPen) the pen is calculated for each contour level using contourPen().
Definition at line 230 of file qwt_plot_spectrogram.cpp.
References QwtPlotSpectrogram::PrivateData::defaultContourPen, and QwtPlotItem::itemChanged().
{
    if ( pen != d_data->defaultContourPen )
    {
        d_data->defaultContourPen = pen;
        itemChanged();
    }
}
| void QwtPlotSpectrogram::setDisplayMode | ( | DisplayMode | mode, |
| bool | on = true |
||
| ) |
The display mode controls how the raster data will be represented.
| mode | Display mode |
| on | On/Off |
The default setting enables ImageMode.
Definition at line 167 of file qwt_plot_spectrogram.cpp.
References QwtPlotSpectrogram::PrivateData::displayMode, and QwtPlotItem::itemChanged().
{
    if ( on != bool(mode & d_data->displayMode) )
    {
        if ( on )
            d_data->displayMode |= mode;
        else
            d_data->displayMode &= ~mode;
    }

    itemChanged();
}
| bool QwtPlotSpectrogram::testConrecAttribute | ( | QwtRasterData::ConrecAttribute | attribute ) | const |
Test an attribute of the CONREC algorithm, used to calculate the contour lines.
| attribute | CONREC attribute |
Definition at line 301 of file qwt_plot_spectrogram.cpp.
References QwtPlotSpectrogram::PrivateData::conrecAttributes.
{
    return d_data->conrecAttributes & attribute;
}
| bool QwtPlotSpectrogram::testDisplayMode | ( | DisplayMode | mode ) | const |
The display mode controls how the raster data will be represented.
| mode | Display mode |
Definition at line 186 of file qwt_plot_spectrogram.cpp.
References QwtPlotSpectrogram::PrivateData::displayMode.
{
    return (d_data->displayMode & mode);
}
 1.7.2
1.7.2

