The vtkQtChartAxis class is used to display a cartesian axis. More...
#include <vtkQtChartAxis.h>
Public Types | |
| enum | AxisLocation { Left = 0, Bottom, Right, Top } |
| enum | AxisDomain { UnsupportedDomain = -1, Number = 0, Date, Time, String } |
| enum | { Type = vtkQtChart_AxisType } |
Public Slots | |
| void | reset () |
| Resets the chart axis view. | |
| void | setOffset (float offset) |
| Sets the contents offset for the axis. | |
Signals | |
| void | layoutNeeded () |
| Emitted when the axis needs to be layed out again. | |
| void | pixelScaleChanged () |
| Emitted when the pixel-value scale changes. | |
Public Member Functions | |
| vtkQtChartAxis (AxisLocation location, QGraphicsItem *parent=0) | |
| Creates a chart axis view. | |
| virtual | ~vtkQtChartAxis () |
| virtual int | type () const |
Setup Methods | |
| AxisLocation | getLocation () const |
| Gets the axis location on the chart. | |
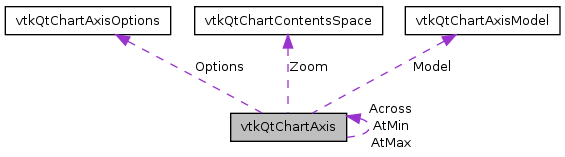
| vtkQtChartAxisModel * | getModel () const |
| Gets the chart axis model. | |
| void | setModel (vtkQtChartAxisModel *model) |
| Sets the chart axis model. | |
| void | setNeigbors (const vtkQtChartAxis *atMin, const vtkQtChartAxis *atMax) |
| Sets the neighboring axes if any. | |
| void | setParallelAxis (const vtkQtChartAxis *across) |
| Sets the parallel axis. | |
| void | setContentsSpace (const vtkQtChartContentsSpace *contents) |
| Sets the axis' contents space object. | |
| void | setDataAvailable (bool available) |
| Sets whether or not data is available for the axis. | |
| bool | isBestFitGenerated () const |
| Gets whether or not the axis labels are generated from the view size. | |
| void | setBestFitGenerated (bool on) |
| Sets whether or not the axis labels are generated from the view size. | |
| void | getBestFitRange (QVariant &min, QVariant &max) const |
| Gets the value range used when generating the axis labels. | |
| void | setBestFitRange (const QVariant &min, const QVariant &max) |
| Sets the value range used when generating the axis labels. | |
| bool | isRangePaddingUsed () const |
| Gets whether or not range padding is used. | |
| void | setRangePaddingUsed (bool padRange) |
| Sets whether or not range padding is used. | |
| bool | isExpansionToZeroUsed () const |
| Gets whether or not the range is expanded to zero. | |
| void | setExpansionToZeroUsed (bool expand) |
| Sets whether or not the range is expanded to zero. | |
| bool | isExtraSpaceUsed () const |
| Gets whether or not extra space is added around the axis tick marks. | |
| void | setExtraSpaceUsed (bool addSpace) |
| Sets whether or not extra space is added around the axis tick marks. | |
| bool | isSpaceTooSmall () const |
| Gets whether or not the space for the axis is too small. | |
| void | setSpaceTooSmall (bool tooSmall) |
| Sets whether or not the space for the axis is too small. | |
Drawing Parameters | |
| vtkQtChartAxisOptions * | getOptions () const |
| Gets the chart axis drawing options. | |
| void | setOptions (const vtkQtChartAxisOptions &options) |
| Sets the chart axis drawing options. | |
Display Methods | |
| void | layoutAxis (const QRectF &area) |
| Used to layout the chart axis. | |
| void | adjustAxisLayout () |
| Used to adjust the bounding width for the axis. | |
| float | getPreferredSpace () const |
| Gets the space needed for the axis. | |
| float | getFontHeight () const |
| Gets the axis label font height. | |
| float | getMaxLabelWidth () const |
| Gets the maximum label width. | |
| float | getTickLength () const |
| Gets the length of the axis label tick marks. | |
| float | getSmallTickLength () const |
| Gets the length of the small axis label tick marks. | |
| float | getTickLabelSpacing () const |
| Gets the distance between the axis label and the tick mark. return The distance between the axis label and the tick mark. | |
| bool | isLogScaleAvailable () const |
| Gets whether or not logarithmic scale can be used. | |
| virtual void | paint (QPainter *painter, const QStyleOptionGraphicsItem *option, QWidget *widget=0) |
| Paints the chart axis using the given painter. | |
Location Methods | |
| virtual QRectF | boundingRect () const |
| QRectF | getBounds () const |
| Gets the bounding rectangle for the axis. | |
| bool | isLabelTickVisible (int index) const |
| Gets wether or not the given label tickmark is visible. | |
| float | getLabelLocation (int index) const |
| Gets the location of the given label. | |
| AxisDomain | getAxisDomain () const |
| Gets the current axis domain. | |
| bool | isValueInDomain (const QVariant &value) const |
| Gets whether or not the given value is in the axis domain. | |
| float | getPixel (const QVariant &value) const |
| Gets the pixel location for the given value. | |
| float | getZeroPixel () const |
| Gets the pixel location for zero. | |
Static Public Member Functions | |
| static bool | isLogScaleValid (const QVariant &min, const QVariant &max) |
| Gets whether or not logarithmic scale can be used for the given range. | |
Static Public Attributes | |
| static const double | MinLogValue |
| Stores the log scale minimum. | |
The vtkQtChartAxis class is used to display a cartesian axis.
Definition at line 45 of file vtkQtChartAxis.h.
| anonymous enum |
| UnsupportedDomain | |
| Number |
Domain for int and double. |
| Date |
Domain for QDate and QDateTime. |
| Time |
Domain for QTime. |
| String |
Domain for QString. |
Definition at line 58 of file vtkQtChartAxis.h.
    {
    UnsupportedDomain = -1,
    Number = 0,
    Date,
    Time,
    String
    };
| vtkQtChartAxis::vtkQtChartAxis | ( | AxisLocation | location, |
| QGraphicsItem * | parent = 0 |
||
| ) |
Creates a chart axis view.
| location | Where on the chart the axis will be drawn. |
| parent | The parent item. |
| virtual vtkQtChartAxis::~vtkQtChartAxis | ( | ) | [virtual] |
| void vtkQtChartAxis::adjustAxisLayout | ( | ) |
Used to adjust the bounding width for the axis.
This method only affects left and right locations. It is called after the neighboring axes have been layed out. The neighboring axes may need more space to display the labels.
| virtual QRectF vtkQtChartAxis::boundingRect | ( | ) | const [virtual] |
| AxisDomain vtkQtChartAxis::getAxisDomain | ( | ) | const |
Gets the current axis domain.
| void vtkQtChartAxis::getBestFitRange | ( | QVariant & | min, |
| QVariant & | max | ||
| ) | const |
Gets the value range used when generating the axis labels.
| min | Used to return the minimum value. |
| max | Used to return the maximum value. |
| QRectF vtkQtChartAxis::getBounds | ( | ) | const |
Gets the bounding rectangle for the axis.
The bounding box returned is only valid after a layout. The rectangle is in chart coordinates.
| float vtkQtChartAxis::getFontHeight | ( | ) | const |
Gets the axis label font height.
| float vtkQtChartAxis::getLabelLocation | ( | int | index ) | const |
Gets the location of the given label.
| index | The index of the label. |
| AxisLocation vtkQtChartAxis::getLocation | ( | ) | const [inline] |
Gets the axis location on the chart.
Definition at line 85 of file vtkQtChartAxis.h.
{return this->Location;}
| float vtkQtChartAxis::getMaxLabelWidth | ( | ) | const |
Gets the maximum label width.
The maximum label width is only valid after a layout.
| vtkQtChartAxisModel* vtkQtChartAxis::getModel | ( | ) | const [inline] |
Gets the chart axis model.
Definition at line 91 of file vtkQtChartAxis.h.
{return this->Model;}
| vtkQtChartAxisOptions* vtkQtChartAxis::getOptions | ( | ) | const [inline] |
Gets the chart axis drawing options.
Definition at line 226 of file vtkQtChartAxis.h.
Referenced by QmitkVtkHistogramWidget::QmitkVtkHistogramWidget(), and QmitkVtkLineProfileWidget::QmitkVtkLineProfileWidget().
{return this->Options;}
| float vtkQtChartAxis::getPixel | ( | const QVariant & | value ) | const |
Gets the pixel location for the given value.
The pixel location relates to the orientation of the axis.
| value | The value to map. |
| float vtkQtChartAxis::getPreferredSpace | ( | ) | const |
Gets the space needed for the axis.
If the axis is horizontal, the space needed is the preferred height. If the axis is vertical, the space needed is the preferred width. The preferred height can be obtained at any time. The preferred width is only valid after a layout.
| float vtkQtChartAxis::getSmallTickLength | ( | ) | const |
Gets the length of the small axis label tick marks.
| float vtkQtChartAxis::getTickLabelSpacing | ( | ) | const |
Gets the distance between the axis label and the tick mark. return The distance between the axis label and the tick mark.
| float vtkQtChartAxis::getTickLength | ( | ) | const |
Gets the length of the axis label tick marks.
| float vtkQtChartAxis::getZeroPixel | ( | ) | const |
Gets the pixel location for zero.
For int and double domains, the pixel location returned is limited by the axis pixel range. For non-numeric domains, the axis minimum pixel location is returned.
| bool vtkQtChartAxis::isBestFitGenerated | ( | ) | const |
Gets whether or not the axis labels are generated from the view size.
| bool vtkQtChartAxis::isExpansionToZeroUsed | ( | ) | const |
Gets whether or not the range is expanded to zero.
This setting only affects the best-fit layout. If the range does not include zero, the range is expanded to include it. This is used by the bar chart to make sure the minimum bar has some length to it.
| bool vtkQtChartAxis::isExtraSpaceUsed | ( | ) | const |
Gets whether or not extra space is added around the axis tick marks.
This setting does not affect the best-fit layout. Extra space is added before the minimum and after the maximum. This is usefull for chart objects that expand around the tick mark like the bar in a bar chart.
| bool vtkQtChartAxis::isLabelTickVisible | ( | int | index ) | const |
Gets wether or not the given label tickmark is visible.
| index | The index of the label. |
| bool vtkQtChartAxis::isLogScaleAvailable | ( | ) | const |
Gets whether or not logarithmic scale can be used.
| static bool vtkQtChartAxis::isLogScaleValid | ( | const QVariant & | min, |
| const QVariant & | max | ||
| ) | [static] |
Gets whether or not logarithmic scale can be used for the given range.
| min | The range minimum. |
| max | The range maximum. |
| bool vtkQtChartAxis::isRangePaddingUsed | ( | ) | const |
Gets whether or not range padding is used.
This setting only affects the best-fit layout. When range padding is used, the axis makes sure there is space between the best-fit range and the actual minimum and maximum labels.
| bool vtkQtChartAxis::isSpaceTooSmall | ( | ) | const |
Gets whether or not the space for the axis is too small.
| bool vtkQtChartAxis::isValueInDomain | ( | const QVariant & | value ) | const |
Gets whether or not the given value is in the axis domain.
| value | The value to test. |
| void vtkQtChartAxis::layoutAxis | ( | const QRectF & | area ) |
Used to layout the chart axis.
This method must be called before the axis can be drawn.
| area | The total chart area. |
| void vtkQtChartAxis::layoutNeeded | ( | ) | [signal] |
Emitted when the axis needs to be layed out again.
| virtual void vtkQtChartAxis::paint | ( | QPainter * | painter, |
| const QStyleOptionGraphicsItem * | option, | ||
| QWidget * | widget = 0 |
||
| ) | [virtual] |
Paints the chart axis using the given painter.
| painter | The painter to use. |
| option | The area to paint and the level of detail. |
| widget | The widget being painted. |
| void vtkQtChartAxis::pixelScaleChanged | ( | ) | [signal] |
Emitted when the pixel-value scale changes.
The pixel-value scale is only modified inside the axis layout method. Charts using this signal should never emit layoutNeeded when responding to this signal. Instead, set a flag to use when the chart layout method is called.
| void vtkQtChartAxis::reset | ( | ) | [slot] |
Resets the chart axis view.
| void vtkQtChartAxis::setBestFitGenerated | ( | bool | on ) |
Sets whether or not the axis labels are generated from the view size.
| on | True if the axis labels should be generated. |
| void vtkQtChartAxis::setBestFitRange | ( | const QVariant & | min, |
| const QVariant & | max | ||
| ) |
Sets the value range used when generating the axis labels.
| min | The minimum value. |
| max | The maximum value. |
| void vtkQtChartAxis::setContentsSpace | ( | const vtkQtChartContentsSpace * | contents ) |
Sets the axis' contents space object.
| contents | The new contents space object. |
| void vtkQtChartAxis::setDataAvailable | ( | bool | available ) |
Sets whether or not data is available for the axis.
This parameter is used when the best fit range is zero. If data is available, the axis generates labels around the data value. This is needed when the data points are the same value for an axis, such as a vertical or horizontal line on a line chart.
| available | True if data is available. |
| void vtkQtChartAxis::setExpansionToZeroUsed | ( | bool | expand ) |
Sets whether or not the range is expanded to zero.
| expand | True if the range should be expanded to zero. |
| void vtkQtChartAxis::setExtraSpaceUsed | ( | bool | addSpace ) |
Sets whether or not extra space is added around the axis tick marks.
| addSpace | True if space should be added around the axis tick marks. |
| void vtkQtChartAxis::setModel | ( | vtkQtChartAxisModel * | model ) |
Sets the chart axis model.
| model | The model to display. |
| void vtkQtChartAxis::setNeigbors | ( | const vtkQtChartAxis * | atMin, |
| const vtkQtChartAxis * | atMax | ||
| ) |
Sets the neighboring axes if any.
The neighboring axes are used when laying out the axis. The axis pixel positions are adjusted to accound for the space requirements of its neighbors.
| atMin | The axis at the minimum value end. |
| atMax | The axis at the maximum value end. |
| void vtkQtChartAxis::setOffset | ( | float | offset ) | [slot] |
Sets the contents offset for the axis.
| offset | The new contents offset. |
| void vtkQtChartAxis::setOptions | ( | const vtkQtChartAxisOptions & | options ) |
Sets the chart axis drawing options.
This method sets all the axis options at once, which can prevent unnecessary view updates.
| options | The new axis drawing options. |
| void vtkQtChartAxis::setParallelAxis | ( | const vtkQtChartAxis * | across ) |
Sets the parallel axis.
| across | The axis parallel to this one. |
| void vtkQtChartAxis::setRangePaddingUsed | ( | bool | padRange ) |
Sets whether or not range padding is used.
| padRange | True if range padding should be used. |
| void vtkQtChartAxis::setSpaceTooSmall | ( | bool | tooSmall ) |
Sets whether or not the space for the axis is too small.
| tooSmall | True if the space for the axis is too small. |
| virtual int vtkQtChartAxis::type | ( | ) | const [inline, virtual] |
const double vtkQtChartAxis::MinLogValue [static] |
Stores the log scale minimum.
Definition at line 463 of file vtkQtChartAxis.h.
 1.7.2
1.7.2

